Drawings
Gantt chart
ActionTree uses matplotlib to visualize Gantt charts. Install all
required dependencies with pip install ActionTree[gantt].
You can draw a Gantt chart of the execution with GanttChart:
>>> from ActionTree import GanttChart
>>> chart = GanttChart(link_report)
>>> chart.write_to_png("link_gantt_chart.png")
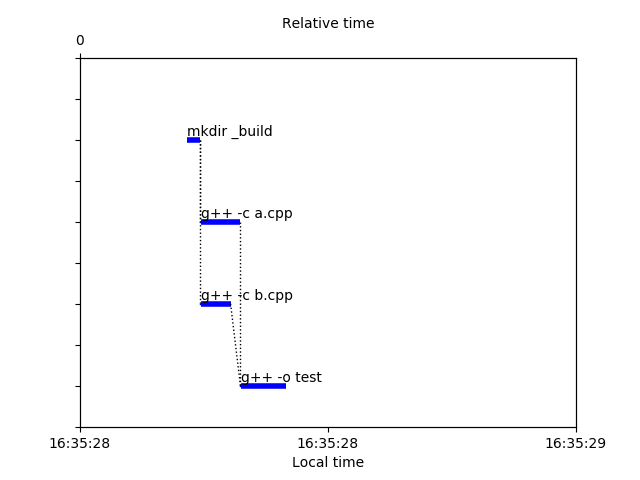
link_gantt_chart.png
Each action is represented by an horizontal line. The left part, optional, is thin. It represents the time the action was ready to execute (all dependencies were done) but waiting for a resource (typically a CPU core to execute on). The right part is thicker and represents the actual execution of the action. Resources and timing are explained in detail later in this user guide.
Actions are linked to their dependencies using thin doted lines.
Actions that failed are in red, and actions that were canceled due to a failure in their dependencies are in grey:
>>> compile_unexisting = CallSubprocess(["g++", "-c", "unexisting.cpp", "-o", "_build/unexisting.o"], label="g++ -c unexisting.cpp")
>>> compile_unexisting.add_dependency(make_build_dir)
>>> link.add_dependency(compile_unexisting)
>>> failed_link_report = execute(link, cpu_cores=1, keep_going=True, do_raise=False)
>>> failed_link_report.is_success
False
>>> chart = GanttChart(failed_link_report)
>>> chart.write_to_png("failed_link_gantt_chart.png")
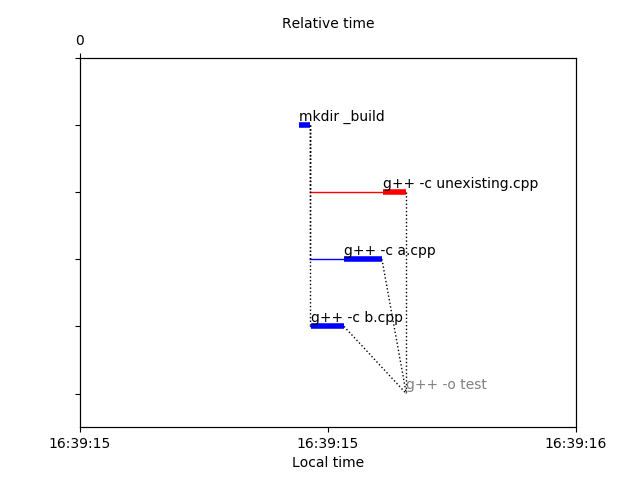
failed_link_gantt_chart.png
Dependency graph
ActionTree uses graphviz to visualize dependency graphs. Install all
required dependencies with pip install
ActionTree[dependency_graphs].
You can draw a dependency graph with DependencyGraph:
>>> from ActionTree import DependencyGraph
>>> graph = DependencyGraph(link)
>>> graph.write_to_png("link_dependency_graph.png")
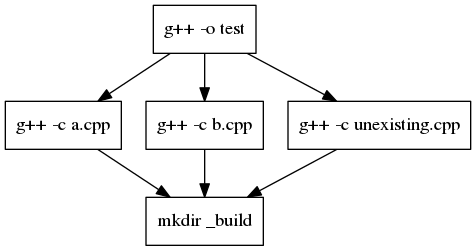
link_dependency_graph.png